Autofocus
To calculate the right focus for an image, we will use the Laplacian derivative filter.
-1 |
-1 |
-1 |
-1 |
8 |
-1 |
-1 |
-1 |
-1 |
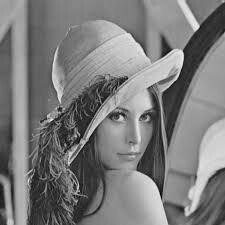
By applying this filter to the image we will obtain the following result. As this is a derivative filter, the intensity of the pixels in the target image will appear greater if the neighboring pixels in the starting image have very differing intensity levels. Indeed, one can see that in the target image there is a greater intensity near the edges.

The last step consists in analyzing the histogram of the image (pixel intensity distribution in the image).
Let’s consider two cases: an image and the same image that a blur filter has been applied to (to simulate a poor focus). The histograms of the image on which the Laplacian filters have been applied are as follows:
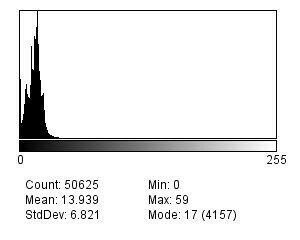
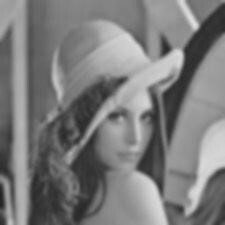

If one calculates the deviation of the two histograms, the unblurred image will have a poorer distribution due to the presence of higher maximum values (more marked edges).
How can you assess the focus quality?
- Collect a set of images (image set A).
- Apply the Laplacian operator to each image (image set B).
- Assess the histograms of image set B
- Identify the histogram with the highest standard deviation.
- The image of set A, corresponding to the identified histogram, is the image with the best focus.
Limits of this approach:
It is based on the comparison between histograms, so this approach is valid only if both images have the same subject.