Edge detection
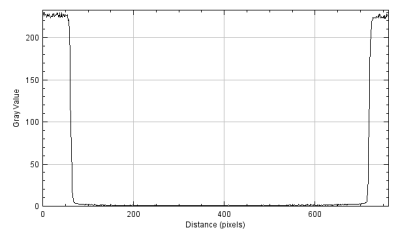
The edges are areas of the image where the intensity of the pixels suddenly varies. As a first step, let’s analyse the plot profile of the following image:
By applying a derivative filter (e.g. Sobel along x), we obtain the following graph (as an absolute value):
The edges are conventionally identified as the local maximum points of this graph. Sometimes, if there is the need to calculate the edge in subpixels, a fit of the neighborhood of the maximum values is carried out with a parabola.
In general, to calculate edges you need:
- A derivative filter
- An instrument to identify the maximum values in the calculated image.
Let’s take a look in detail of the procedure starting from the following image:
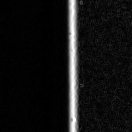
If we apply Sobel we obtain:
Let’s analyse in detail the previous image. To identify local maximum values we use an algorithm called Canny.
As well as suppressing points that do not represent a local maximum value, the algorithm carries out a procedure called thresholding with hysteresis. Two thresholds are defined, a low and a high one, which at each point are compared with the gradient. A point with a gradient above the upper threshold will certainly be accepted, a point with a gradient below the lower threshold will be rejected. A point with a gradient between the two thresholds is accepted only if the first neighbouring point has already been accepted.
The presence of two thresholds (hence the reference to the hysteresis) is justified by the fact that it is practically impossible to find a single brightness gradient value to determine whether a point belongs or does not belong to an edge. At the end of this step a binary image is obtained, where each pixel is marked as belonging or not belonging to an edge.


